The content on this page and its subpages applies to legacy versions of SSI's Schedule Risk Analysis tools and is no longer maintained.
Run SRA Quick Start Instructions
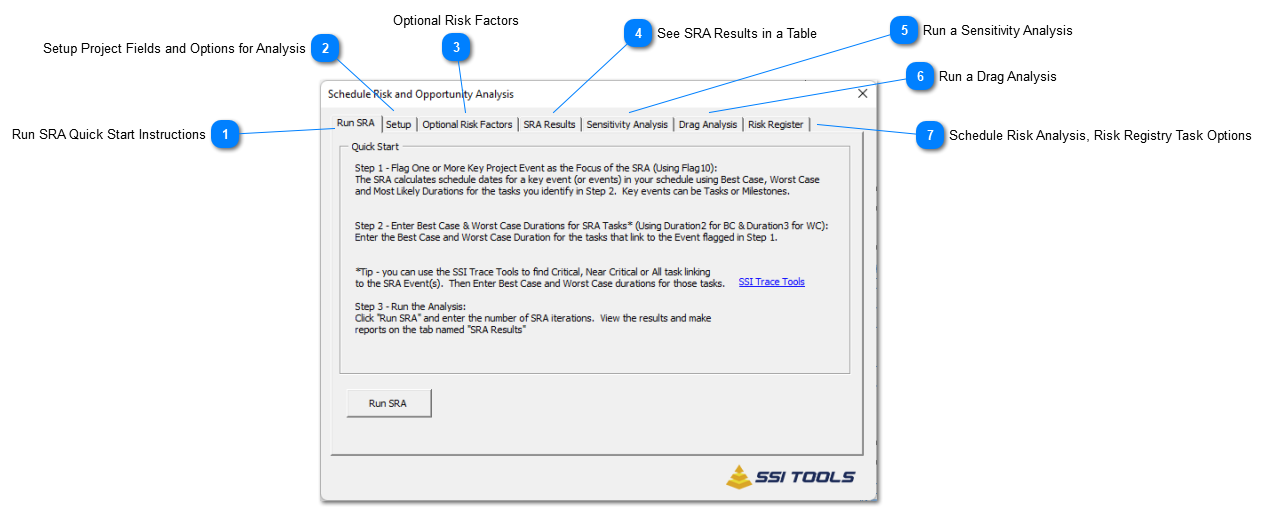
The SSI Tools Schedule Risk Assessment (SRA) works with the tasks in your schedule that you have explicitly identified for the analysis. You identify tasks for the model in two ways:
Mark one or more key project milestone as the SRA Key Event (The Focus of your SRA). The finish date (or dates) for these items is what gets assessed during the SRA.
Tasks that lead to your SRA Focus Events have Best-case and Worst-case duration values which you enter in two of the Duration1 - 10 fields. Tasks without Best-case and Worst-case dates are not used by the analysis.
Tip - You can use SSI Trace Tools to find Primary, Secondary and Tertiary drivers or all Predecessor tasks leading to SRA Focus Events. This can be helpful to ensure you have evaluated Best-case and
3. Press Run SRA and enter the Number of SRA Iterations – the default is 100 iterations. Each iteration is a simulation (or “what-if” analysis) of the schedule date for SRA Focus items using task duration within the range of Best-case and Worst-case values - but favoring the Most-likely value.
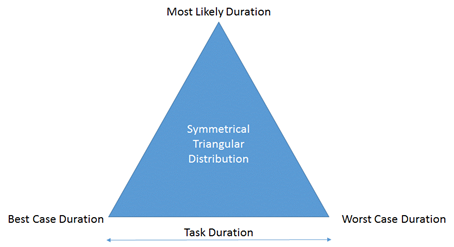
SSI Tools uses a Symmetrical Triangular Distribution for its statistical modeling. This means task duration closest to or exactly on Most Likely values are favored and used more frequently than values toward the extreme ends of the range (Best and Worst case). To illustrate this statistical modeling approach consider the area within the triangle below. Most of the area within the triangle is near the point labeled Most Likely Duration. If 100 evenly placed dots were distributed within the triangle, and a value was assigned to the horizontal position of each dot, most of the dots would have values close to the peak of the triangle and few would be on or near the right or left extreme. Think of the values corresponding to the 100 dots as the random duration value used for each of the 100 SRA iterations.
Or you can Imagine a roulette wheel that favors certain numbers over others. This roulette wheel favors the number 10 (the most likely value) and is more likely to hit numbers close to 10 than it is to hit the lowest number (Best-case) or the highest number (Worst-case). The number 10 occurs 6 times, 9 & 11 each occur 3 times, 8 & 12 occur two times each. The lowest and highest numbers only occur once.
Though it’s a best practice to explicitlyenter Best-case and Worst-case duration values, SSI’s SRA tools provides an optional way to mathematically calculate these values using a Risk Factor you enter in a number field using the Optional Risk Factors tab.
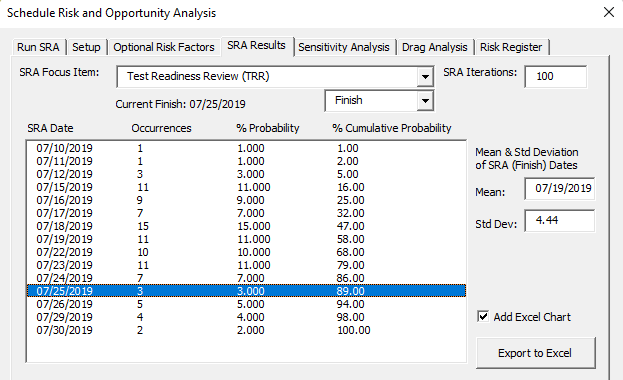
Once the SRA is completed, the SRA Results tab will open to display the resulting probability of completing the SRA Focus Items on or before a particular date.
In this example the current finish date for Test Readiness Review (TRR) is 07/25/2019 but the project only has a 89% chance of making TRR by that date.
The SSI Tools Schedule Risk Assessment (SRA) Tools includes Sensitivity Analysis modeling to identify tasks having the most potential to accelerate or delay a project if their duration or Period of Performance changes. When schedule variances occur, a sensitivity analysis tells project management which tasks to monitor and make the priority of a corrective action plan.
A Sensitivity Analysis is a series of “What-ifs” such as:
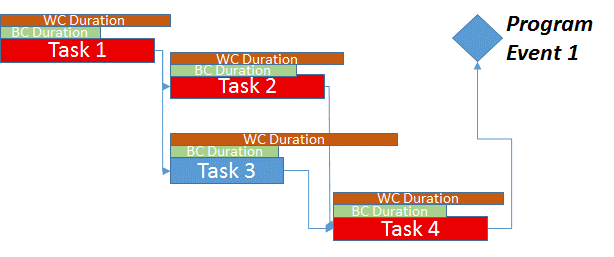
· What would the schedule date for the milestone named “Program Event 1” be if the duration of Task 1 is set to its Worst-case value?
· What would the schedule date for the milestone named “Program Event 1” be if the duration of Task 1 is set to its Best-case value?
Critical path drag is an assessment of each task and each predecessor dependency on the driving path that leads to a key program event under analysis.
One-by-one, the duration of each of these tasks is shortened to the duration specified by the user and the effect on the program event under analysis is determined. Likewise, if any of these tasks have a predecessor with lag, that lag is set to zero and the impact on the program event is calculated.
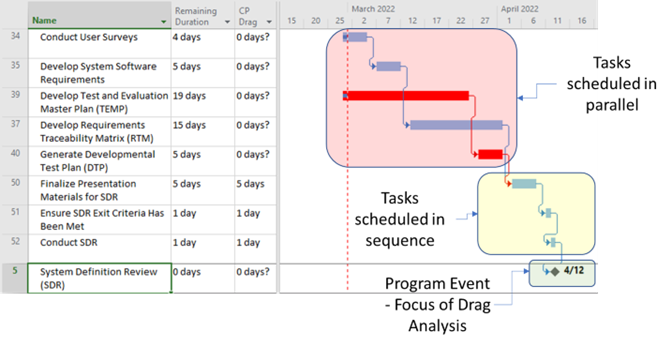
Since many driving path tasks may be performed in parallel, the amount of Critical Path Drag is not always equal to a driving task’s remaining duration. A Drag analysis determines the exact portion, or amount, of a task’s duration that can be reduced to achieve acceleration of a particular program event.
In the drag analysis example below, all 8 tasks, regardless of parallel scheduling or sequential scheduling, drive the program event named System Definition Review (SDR). However, only the sequential tasks, by themselves, can accelerate SDR. A combination of tasks performed in parallel may be able to accelerate SRR, but none of these, individually, has its own acceleration potential (or Drag). The column titled “CP Drag” shows the exact number of days you can reduce each task, by itself, to accelerate the focus of the drag analysis.
The Drag analysis included with SRA + Sensitivity Analysis tools enables additional options such as testing drag using a task-by-task duration set by the user. See these duration and reporting options here: Drag Analysis Results and Options for Reporting.
Drag Analysis Example
Note - SSI's Dependency Analysis tools includes its own Drag Analysis.
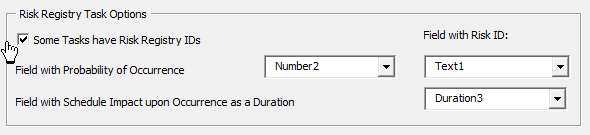
Options on the Setup tab, include Risk Registry Task Options. These options enable the identification (by their project Field with Risk ID), of certain tasks that are modeled as having a "conditional" duration in the SRA model according to the value in the project Field with Probability of Occurrence (between 0% and 100%) and their project Field with Schedule Impact upon Occurrence as a Duration.
When these options are used, Risk Register tasks are ignored by the normal Monte Carlo 3-point duration modeling that uses Best-case, Worst-case, and Most-likely values Instead, the analysis uses the probability of occurrence value to apply the duration specified by the Schedule Impact upon Occurrence. Therefore, if you run 100 iterations in an SRA and a Risk Register task has a 25% probability of occurrence with a 10 day schedule impact, 25 of the 100 iterations will implement a 10-day duration for the task and the other 75 iterations will use the task's current remaining duration.
See the examples below for ways you can use these features to model both Risk and Opportunity.
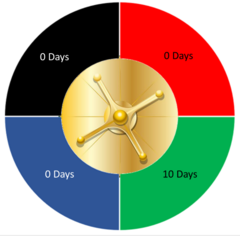
What if you have a task that represents Risk to delay the schedule with a 25%. Probability of Occurrence in the program’s Risk Registry? This roulette wheel shows 3 out of 4 outcomes would result in a task’s duration being zero days and 1 of 4 would set the task’s duration to 10 days. Therefore, the likelihood that this task will impact the schedule by adding 10 days to a path of linked tasks is 25%. In other words, its Probability of Occurrence in the Risk Register = 25% and its Schedule Impact upon Occurrence = 10 Days
Conditional Opportunity Task modeling
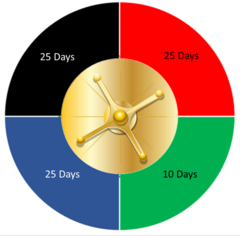
Or… you may have a task that represents an Opportunity to accelerate the schedule with a 25%. Probability of Occurrence in the program’s Risk Registry. This roulette wheel shows 3 out of 4 outcomes would result in a task’s duration being 25 days and 1 of 4 would set the task’s duration to 10 days (a 15-day acceleration). Therefore, the likelihood that this task will accelerate the schedule by reducing a path by 15 days is 25%. In other words, its Probability of Occurrence in the Risk Register = 25% and its Schedule Impact upon Occurrence is 15 days less than its current duration of 25 days
.
· Of course, you can set the Probability of Occurrence to any value between 1% and 100% and the configuration of the roulette wheel will adjust to reflect each task’s Risk or Opportunity probability.