Running a Drag Analysis
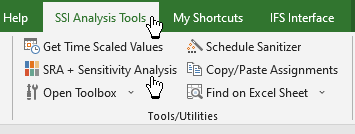
Running a Drag Analysis is simple. Just select one or more items in your schedule, making them the Focus Item of the analysis. Then click SRA + Sensitivity Analysis from the Tools/Utilities group of the SSI Analysis Tools menu.
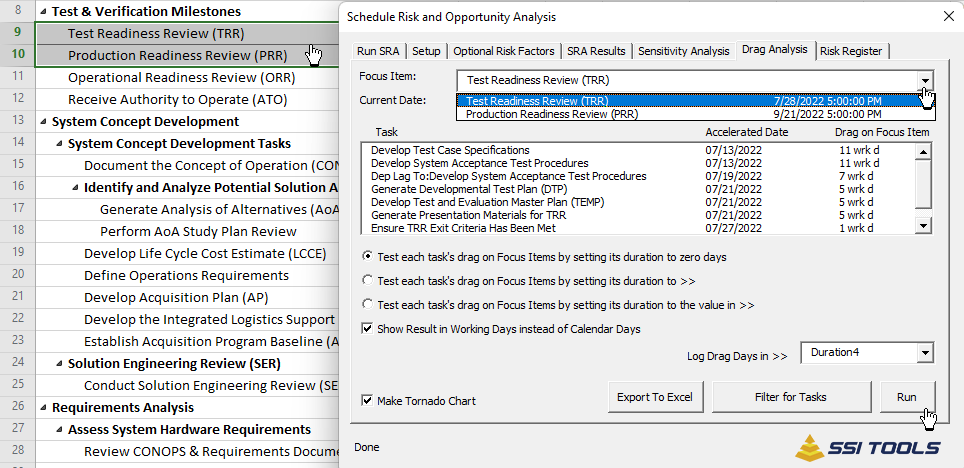
Then click Run in the lower right corner of the Drag Analysis tab of the Schedule Risk and Opportunity Analysis form.
The result of the analysis is displayed in the task list showing the Task name and its amount of potential acceleration and drag on the current focus item.
· Name is the task name of an item having drag on the focus. However, if a task has one or more predecessors with lag causing drag on the focus item it will display “Dep Lag to:” plus the task name.
· Accelerated Date is the potential date of the focus item. Therefore, if you can reduce the task’s duration by the amount of Drag on Focus Item, the focus item will move to the date shown. It is important to note that Accelerated Date relates to the Focus Item (usually a program event or milestone), not the task in the list.
· When you change the Focus Item using the drop-down lost at the top of the form, the list is recreated to show drag relative to the current focus item.
· Double-click any task in the list to Go To that task in the active schedule.
Drag Analysis Options
· Test each task's drag on Focus Items by setting its duration to zero days does the following:
o One-by-one, the remaining duration of each task driving the focus item will be set to zero days and a calculation will be performed to determine the amount of acceleration, if any, that has on the focus item.
o After the calculation is performed for the subject task, its prior remaining duration is restored, and the analysis moves to the next driving path task.
o
· Test each task's drag on Focus Items by setting its duration to >> does the following:
o One-by-one, the remaining duration of each task driving the focus item will be set to the number of days specified by the user. Then a calculation is performed to determine the amount of acceleration, if any, that duration value has on the focus item.
o After the calculation is performed for the subject task, its prior remaining duration is restored, and the analysis moves to the next driving path task.
· Test each task's drag on Focus Items by setting its to the value in >> does the following:
o One-by-one, the remaining duration of each task driving the focus item will be set to the number of days in the number field selected by the user. Then a calculation is performed to determine the amount of acceleration, if any, that duration value has on the focus item.
o After the calculation is performed for the subject task, its prior remaining duration is restored, and the analysis moves to the next driving path task.
· The amount of Drag on the focus item can be shown in Working days or Calendars using this option:
· Use Log Drag Days in >> to record drag days in a specified Duration field for each task having drag on the focus item.
· Once the analysis is complete, you can Filter for Tasks in the active project having drag on the focus item and you can click Export to Excel to make a worksheet of tasks having drag on the focus item.
Drag Analysis Export to Excel
The Drag Analysis Focus Item section:
The first section of the Export to Excel, titled The Drag Analysis Focus Item displays the following information about the Focus item: Unique ID, Name, Current Finish.
· Potential Finish is the calculate finish date of the Focus item if a task, shown in the next section, has its duration set to its Optimized Duration.
· Drag is the difference between the focus item’s current finish and its potential finish. This is also known as Critical Path Drag.
Drag Analysis Task section
The next section of the Export to Excel, titled Drag Analysis Task displays the following information about each task having drag on the Focus item: Unique ID, Name, Duration (which is the task’s current remaining duration).
· Potential Duration is the duration value set during the run time of the analysis. This value is determined by the option set by the user. Its value can be zero, a user defined duration that is common for all tasks or a user defined duration that is specific to each task
· Optimized Duration is the duration of the task that yields the most acceleration of the Focus item. Reducing a task’s duration less than the Optimized Duration will not result and any additional acceleration of the focus item.
The last column, Drag Potential, is only used if the user selects the Tornado Chart option. This is simply the column named Drag represented as a bar graph. This gives the reader a visual depiction of the highest to lowest acceleration potential according to its associated task in the schedule.
Example Export to Excel