SSI Tools for Microsoft Project

User guide

×
Menu
Index

Sensitivity Analysis

Sensitivity Analysis
1

Sensitivity Analysis

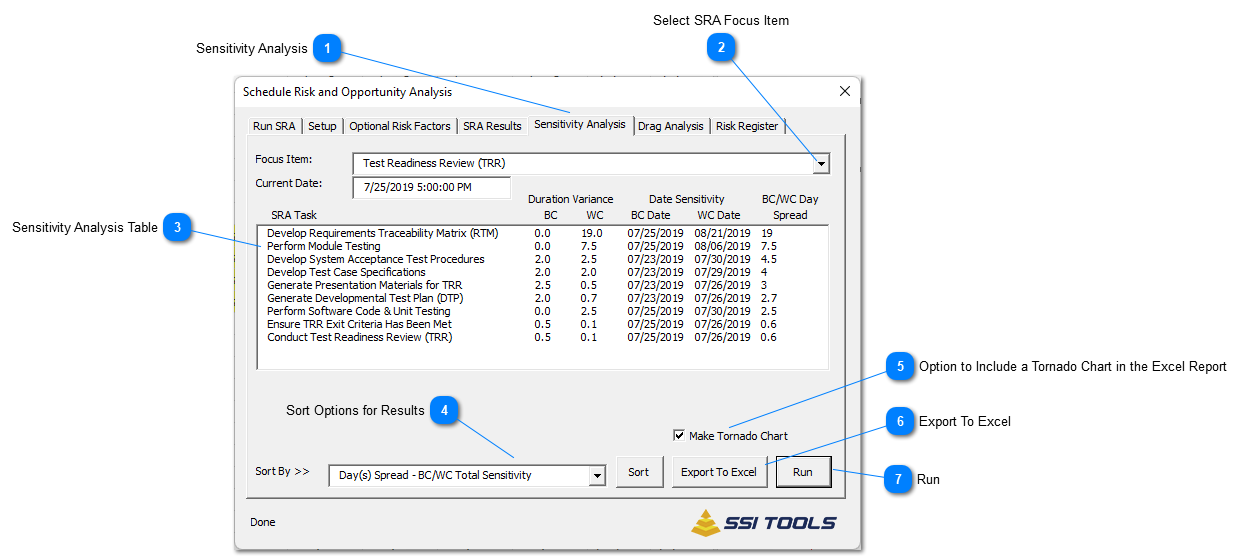
A Sensitivity Analysis identifies the tasks having Risk or Opportunity to Delay or Accelerate the schedule.
A “what-if” duration analysis is performed on each task in the current schedule that has a Best-case and Worst-case duration value.  The duration of each task, in turn, is set to its Best-case and Worst-case value and its effect on items in the schedule flagged as SRA Focus events is calculated and recorded in the results list.
 
A Sensitivity Analysis helps the analyst identify tasks in the schedule that have the potential to delay or accelerate key program events.  Tasks with the greatest Worst-case (WC) Duration Variance present the most Risk to delay the project and the tasks with the greatest Best-case (BC) Duration Variance present the most Opportunity to accelerate the project.  A Sensitivity Analysis is useful to identify and properly set task priorities on a project.
 
 
2

Select SRA Focus Item

A list of items in the Schedule flagged as SRA Key Events.  When an SRA is performed, the effect of SRA modeling and simulations is calculated for these items.  Selecting items from this list shows results that correspond to the selected item.
 
3

Sensitivity Analysis Table

Results of the Sensitivity Analysis respective of the selected SRA Focus Item are shown in this table.  These results can be sorted and exported to Excel for further analysis.

 
4

Sort Options for Results

Sort by:
Day(s) Spread - BC/WC Total Sensitivity (Day difference between Worst-case date and Best-case date)
BC Variance - Opportunity to Accelerate Schedule (Day difference between Best-case date and Current date of the Focus Item)
WC Variance - Risk Potential to Delay Schedule (Day difference between Worst-case date and Current date of the Focus Item)
 
 
5

Option to Include a Tornado Chart in the Excel Report

 
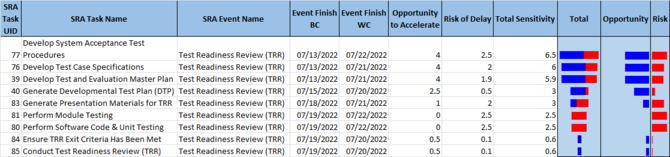
Click Export to Excel with the Tornado Chart option to make a worksheet and chart of the results with these columns:
·     SRA Task UID – Unique ID of the task with sensitivity to the SRA Event
·     SRA Task Name – Name of the task with sensitivity to the SRA Event
·     SRA Event Name – Unique ID of the SRA Event
·     Event Finish BC – Finish of the SRA Event if the task is completed on its Best-case duration
·     Event Finish WC – Finish of the SRA Event if the task is completed on its Worst-case duration
·     Opportunity to Accelerate – Number of working days the task could accelerate the SRA Event if it is performed per its Best-case duration
·     Risk of Delay – Number of working days the task could delay the SRA Event if it is performed per its Worst-case duration
·     Total Sensitivity – Work day difference between Event Finish BC and Event Finish WC
·     Total – “Tornado” bar chart showing the Total Sensitivity
·     Opportunity – “Tornado” bar chart showing the Opportunity portion of Total Sensitivity
·     Risk – “Tornado” bar chart showing the Risk portion of Total Sensitivity
 
 
6

Export To Excel

Generates a report in Excel like the one shown below (with or without the "Tornado" chart in the last 3 columns)
 
7

Run

Starts the Sensitivity Analysis in the current project
 
 
Made by Dr.Explain, software documentation tool