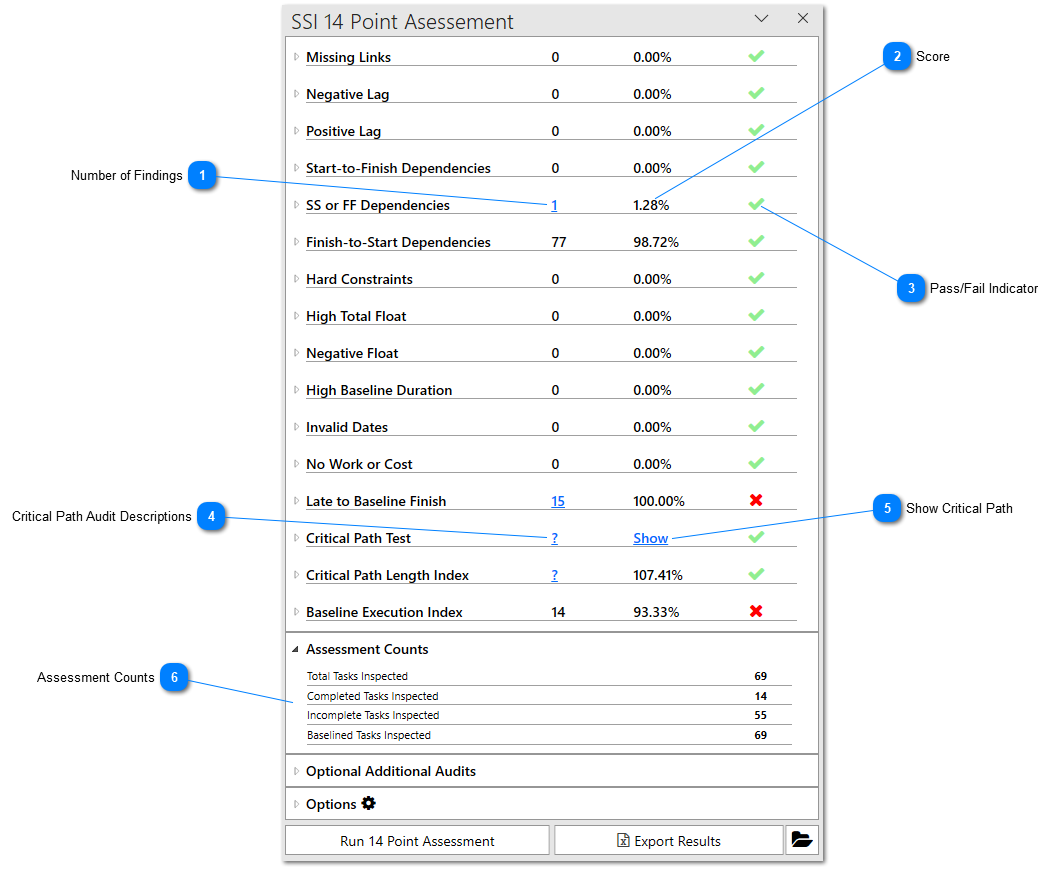
After the 14 Point Assessment has been run, results will be displayed immediately to the user in the 14 Point Audits section of the tool.
Number of Findings
The second column of values represents the number of findings from each audit. In this example, one dependency in the schedule that was analyzed has a Start-To-Start or Finish-to-Finish dependency. This number can be clicked on to filter the schedule for the tasks found.
The percentage in the third column of values represents the overall score of the audit (number of findings/number of items evaluated). In this example, 1.28% of all dependencies in the schedule analyzed have a Start-to-Start or Finish-to-Finish dependency type.
Clicking the ? icon in the results of the Critical Path Test or Critical Path Length Index audits will open a web browser to a description of those audits
Clicking the "Show" Text on the Critical Path Test audit will show the critical/driving path analyzed by the tool in the Gantt chart of Microsoft Project.
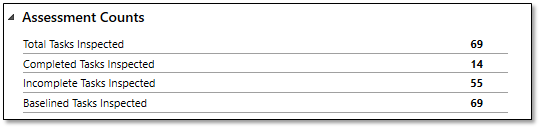
Once the 14 Point Assessment has been run, the raw total number of tasks analyzed will be automatically shown in the Assessment Counts section along with the number of completed, incomplete, and baselined tasks analyzed.








 indicates the schedule passed.
 indicates the schedule failed.