A Sensitivity Analysis is used to identify the activities, Risks, and Opportunities that have the greatest potential to influence the completion date of a Key Event. Unlike a Schedule Risk Assessment, which evaluates the probability of achieving an important events or milestones by a given date, a Sensitivity Analysis focuses on determining which tasks have the largest impact on key events. This information helps project teams understand where management attention and corrective action efforts are most likely to be effective.
A Sensitivity Analysis works by performing a series of controlled "what-if" scenarios. Each activity with defined Duration Uncertainty estimates, Risk, or Opportunity is evaluated independently. The tool isolates each item and determines where the Key Event(s) would finish if the task were set to its Best-Case duration, its Worst-Case duration, or if the Risk or Opportunity were realized. The resulting change in the Key Event date is then compared to its original finish date to determine the task’s level of sensitivity.
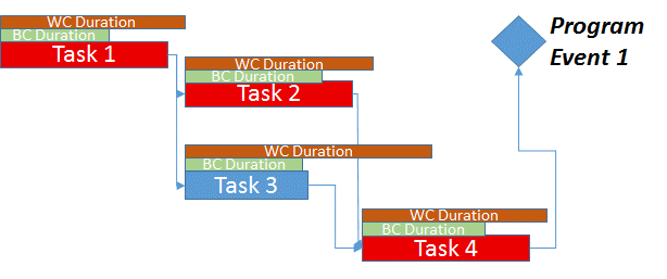
Observe the following diagram:
Using the diagram above as an example, a Sensitivity Analysis would evaluate:
• What is the finish date of “Program Event 1” if the duration of Task 1 is set to its Best-Case estimate?
• What is the finish date of “Program Event 1”if the duration of Task 1 is set to its Worst-Case estimate?
• And so on for Task 2, 3 and 4
When the change causes a Key Event to occur earlier than planned, the effect is considered an Opportunity. When the change causes a Key Event to occur later than planned, the effect is considered a Risk. These values are usually plotted out on a graph called a Tornado Chart. The delta between the original finish date and the new date is the amount of Risk or Opportunity. These values are usually plotted out on a graph called a Tornado Chart.