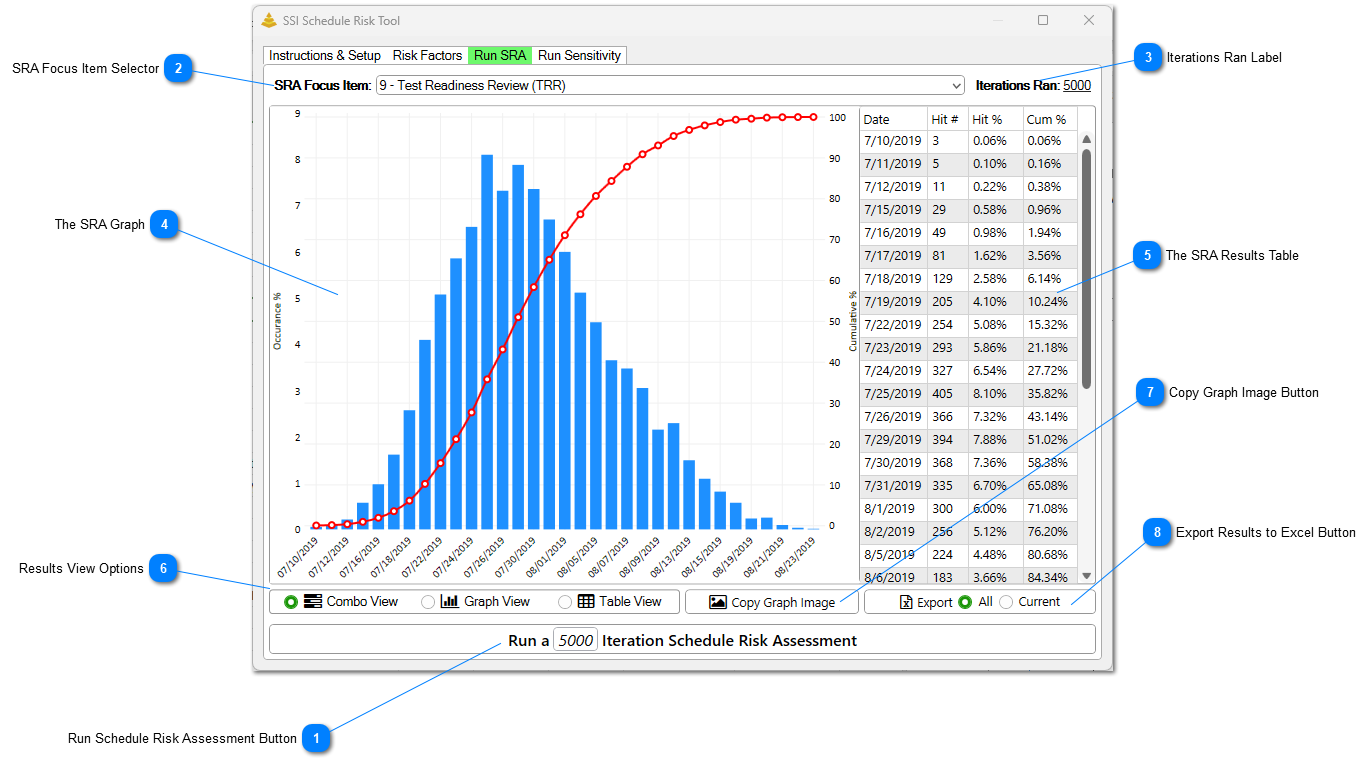
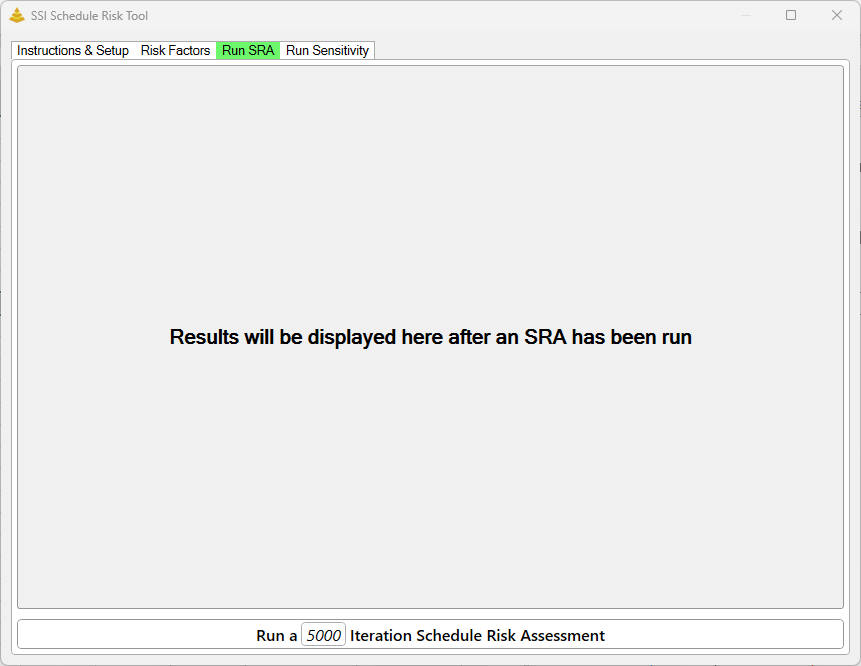
Click this button to run a Schedule Risk Assessment for the Key Events flagged using the specified number of simulation iterations. Enter a value between 1 and 1000000 in the Iterations field to control how many simulations will be performed. In general, a higher number of iterations produces more statistically reliable results but also increases the time required to complete the analysis. For most schedules, 5000 iterations provides an excellent balance between accuracy and performance, as increasing the iteration count beyond this point typically results in only marginal improvements to the statistical stability of the results. The SRA results views and related controls remain hidden until a Schedule Risk Assessment has been successfully completed.
The value selected in this drop-down menu specifies which Key Event results are displayed. All tasks identified as Key Events (that is, tasks with a value of Yes in the specified Key Event Flag field) are available for selection. Choosing a different Key Event updates the displayed results without requiring the Schedule Risk Assessment to be rerun.
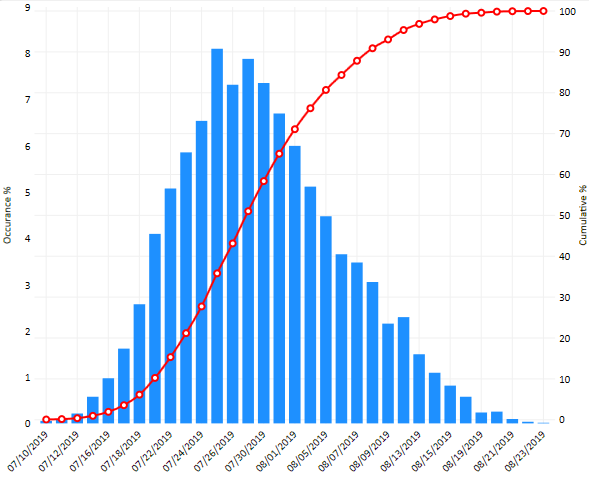
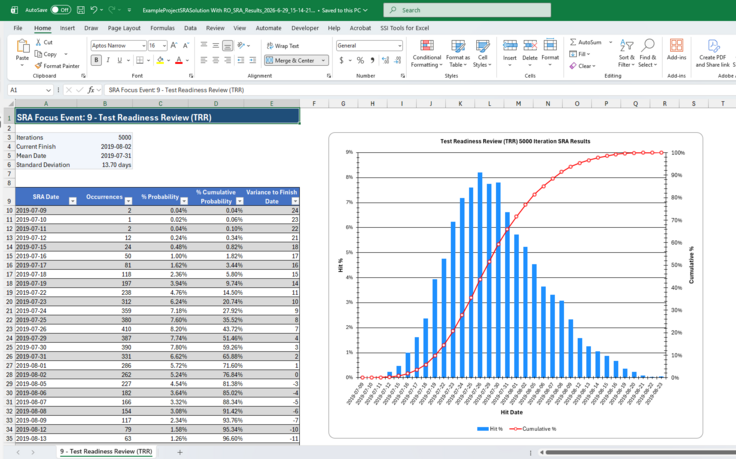
This is the graphical representation of the SRA results. The SRA graph is a dual-axis graph that displays the range of possible completion dates for the selected Key Event and the probability associated with those dates. The horizontal axis represents potential completion dates
The graph contains two data series:
• Histogram (Frequency Distribution): The vertical bars represent the percentage of simulation iterations that resulted in the Key Event completing on a specific date. The left vertical axis shows the occurrence percentage.
• Cumulative Probability Curve: The line represents the cumulative probability of completing the Key Event on or before a given date. The right vertical axis displays this probability as a percentage.
Hovering over any point on the histogram or cumulative probability line will display detailed information about it.
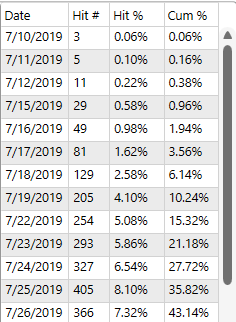
This table contains the underlying data used to generate the graph. Each row corresponds to a completion date identified during the assessment.
The results table contains the following columns:
• Date – The simulated completion date for the selected Key Event.
• Hit # – The number of simulation iterations that resulted in the Key Event completing on that date. For example, a value of 300 indicates that the Key Event completed on that date in 300 separate simulation iterations.
• Hit % – The percentage of total simulation iterations that resulted in the Key Event completing on that date. This value corresponds to the histogram displayed in the results graph. For example, a Hit % of 6% indicates that 6% of all simulation iterations produced that completion date.
• Cum % – The cumulative probability of the Key Event completing on or before the specified date. This value corresponds to the cumulative probability curve displayed in the results graph. For example, a Cum % of 50% indicates there is a 50% probability that the Key Event will complete on or before that date.
Click this button to copy the SRA Graph as an image to the clipboard. This image can then be pasted in external applications. This button can only be pressed while in Combo or Graph View.
Click this button to export the Schedule Risk Assessment results to an Excel workbook. The exported workbook includes the data displayed in the SRA Results table, along with a graphical representation of the results for the selected Key Event.
If All is selected when this button is pressed, results for every Key Event included in the assessment are exported to separate worksheets within the workbook.