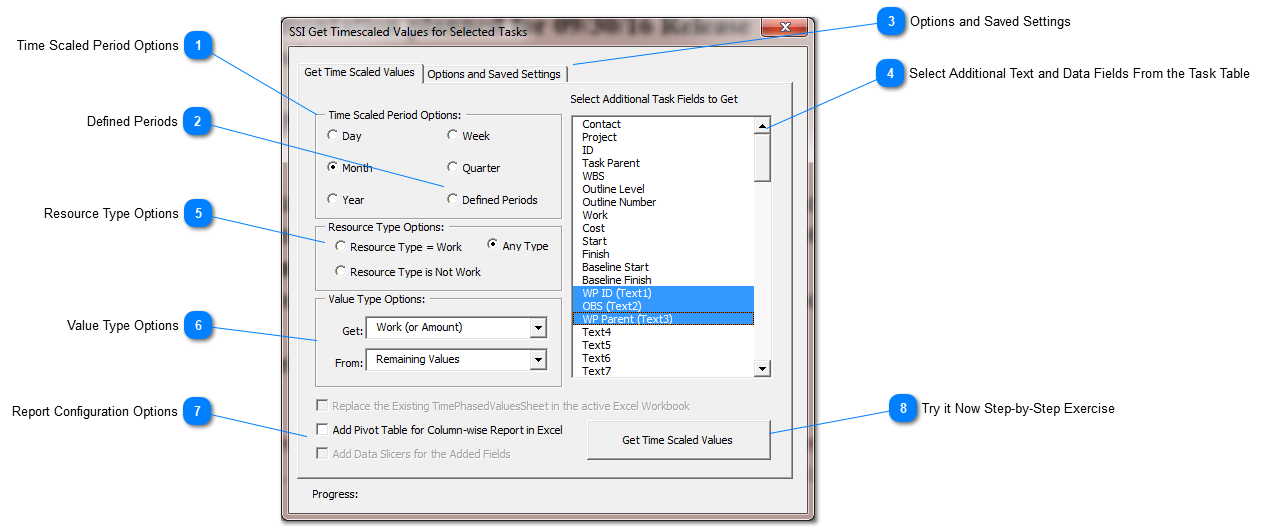
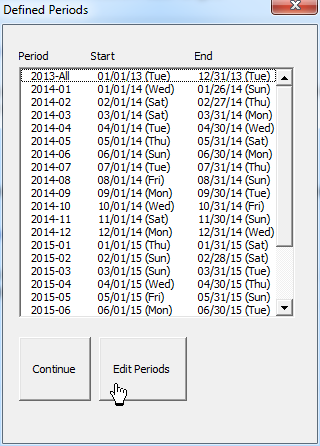
Defined periods are custom reporting increments for Time Scaled values (from a user defined Start date through a user defined Finish date). Users can create one or more Defined Periods Definition tables using the for that appears when the Defined Periods option is selected.
Select Additional Text and Data Fields From the Task Table
The Task table in Microsoft Project contains Text, Flag, Number and other data fields. Many of these can be added to your Time Scaled report. If you have added custom names to these fields, those custom names will appear in the field list and on your report
1. Check the Option named Replace the Existing TimePhasedValuesSheet in the active Excel Workbook (if it exists) if you want to "refresh" the data without altering changes you may have made to Pivot Tables or other used added analysis
2. Check Add Pivot Table to automatically create a Pivot Table based on Time Scaled Data
3. Office 2013 and higher users can add Data Slicers to a Pivot Table by checking this option
Process Steps for the Exercise are shown in Black text. Additional notes about the feature or options are shown in blue.
Using the Example Project that comes with SSI Tools, make a Time Scaled Values report as follows:
Step
Description / Image View
Step 1.
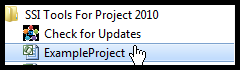
Open Microsoft Project and open the project named ExampleProject.mpp. This file is in the installation folder for SSI Tools and can be found by selecting SSI Tools for Project from the Windows Start menu.
Step 2.
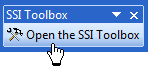
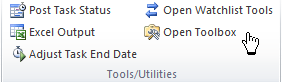
Open the Time Scaled Values tool by selecting the SSI Toolbox icon on the Microsoft Project toolbar or ribbon
Project 2003 - 2007 Toolbar
Project 2010 - 2013 Ribbon
Step 3.
Click the Time Scaled Period Option named Defined Periods. For the exercise, just press Continue to accept the time scaled periods as shown
Notes about Report Periods
A Time Scaled Values report can group data by Day, Week, Month, Quarter, Year or user defined date ranges (Fiscal Monthly data for example). See the note below for more information about defining custom date ranges.
Notes about Defined Periods
If needed you can select Edit Periods and change the Period Start, Period End, Period Label and Work Hours in the Period.
Defined Periods allows the user to group work and cost time scaled values by date ranges. These ranges can be Fiscal Months or other custom defined periods. For example, you may want to group all completed values into large date ranges (by year for example), near term values into Monthly or Weekly ranges and far term values into Quarterly period ranges. Just remember not to leave any gaps in your date ranges, otherwise, you might miss some of the values you need to analyze.
Step 4.
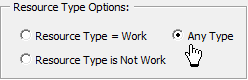
Select Any Type from the Resource Type Options. This will use all resource types for the report.
Notes about Resource Types
Microsoft project Resource types include work and non-work resource types. Typically, work labor types can be reported as work hour or work cost in a time scaled values report. Non-labor may only provide cost values for the report.
Step 5.
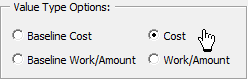
Select Cost from the Value Type Options. This option will generate time scaled values from the cost associated with resources assigned to tasks.
Step 5.
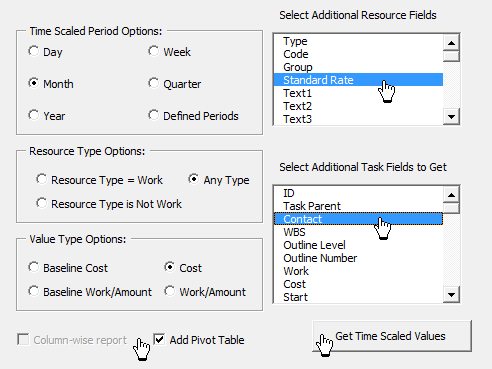
Configure your report as follows:
1. Add a Pivot Table to the report
2. Select the Additional Resource Field named Standard Rate
2. Select the Additional Task Field named Contact
3. Click Get Time Scaled Values
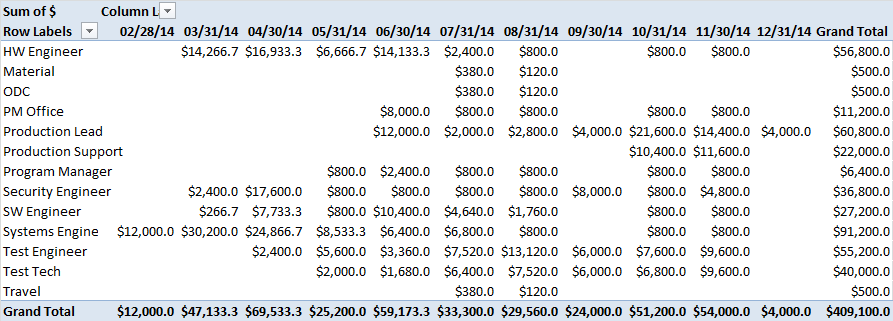
A Excel workbook is created with a sheet named TimePhasedValuesSheet that includes one row for each time scaled value increment. Shown below is the optional Pivot Table.
Notes about Pivot Table reports
If you have experience making and using pivot tables in Microsoft Excel you can tailor this report to suit your needs. If you need additional help, Structured Solutions offers one-on-one instructions on Excel, Pivot tables and most Office applications for an affordable hourly rate. See this link to schedule your session with one of our professionals.