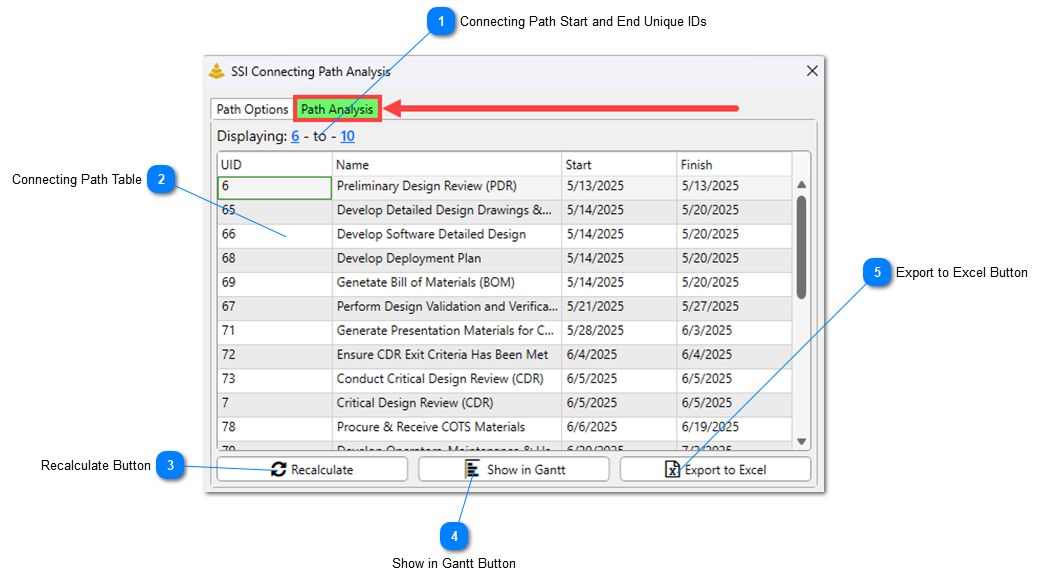
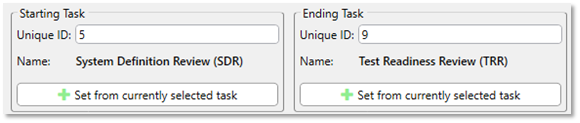
This label represents the Unique ID of the start and end points of the Connecting Path displayed in the table. Clicking on either of these numbers will select that activity in the Gantt Chart.
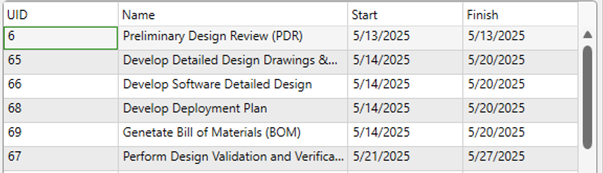
The table in the Path Analysis tab displays the results of the Connecting Path Analysis. This table provides an alternate way of viewing the output outside of just the Gantt Chart view.
Within the table, the Unique ID, Name, Start, and Finish dates of each Connecting Path Activity will always be displayed. If the options to Log Driving Slack from the start task or To the End task were turned on, those values will also be displayed in the table
This button can re-filter the Microsoft Project Gantt Chart for the Connecting Path displayed in the table using the same settings currently applied in the Output group on the Path Options tab.
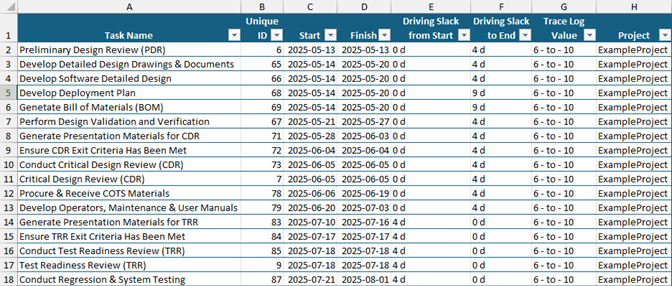
This button will export the data in the Connecting Path Table to an Excel Spreadsheet. In addition to the data in the columns displayed in the table, the title of the Project each activity on the Connecting Path belongs to is displayed in the spreadsheet.
By default, these Excel exports are saved in [SSI_Tools Installation Location]\Exports\Connecting Paths. The file name will include the UIDs of the starting and ending points of the connecting path and the date and time the export occurred.