Other Baseline & Forecast Performance Analysis Reports
SSI Earned Value Express includes a few other reports that compare Baseline dates and durations against actual and forecasted dates and durations.
In an Earned Schedule report, Work Packages rollup to a Work Package Parent by default, but you can tailor the groups and rollups to suite your own needs using the Earned Schedule Pivot table and its underlying data table.
The Program Schedule Execution Profile is a performance Management tool comparing Actual task Finishes with Baseline or Snapshot finishes. Using this information, you can calculate Baseline Execution Index (BEI) and Current Execution Index (CEI). A “Snapshot” is typically captured at the start of a reporting period. It is simply a copy of Start and Finish dates, in Start/Finish 1-10 in Microsoft Project, when the period began. Having a Snapshot enables the calculation of Current Execution Index (CEI), the number of tasks planned to finish in each period vs. the number of tasks that did finish in the same period.
If 100 tasks were scheduled to finish through the current reporting period but only 70 of those tasks are 100% done, Baseline Execution Index (BEI) is .70, meaning the project is only finishing 7 out of every 10 tasks it planned to finish to date. Similarly, if 10 tasks had a finish date at the beginning of a reporting period but only 5 of those tasks finished by the end of the reporting period, CEI would be .50.
Current Execution Index (CEI) measures how accurately the program forecasts its performance each month. It can be used to measure variances the occur in the current month whereas Baseline Execution Index (BEI) is a cumulative measure of performance from inception. CEI and BEI provide an early warning of schedule delays and measure of how realistic planning and forecasting is being conducted on a program.
· Period Baseline is the count of tasks with a Baseline Finish date in each period.
· Period Actual is the count of tasks with an Actual Finish date in each period.
· Period Finish is the forecast of tasks that will finish in each period after the current project status date.
· Period Prior is the count of tasks with a “Snapshot” Finish date in each period. Period BEI is the Baseline Execution Index or the ratio of tasks that finished in the period vs. the tasks baselined to finish in the period.
· Cumulative BEI is the Baseline Execution Index to date through the current reporting period.
· Cumulative BEI is a forecast of the Baseline Execution Index according to future forecasted finish dates.
· Cumulative Baseline, Actual, Finish and Prior is the cumulative count of each respective value.
A variation of this report is the Hit/Miss report. BEI only count tasks with a baseline finish date through the current reporting period, therefore, if you finish a task early and its baseline is later than the status date, it does not count in the BEI calculation. A Hit/Miss report counts all task with an actual finish date regardless of which period the baseline finish occurs.
Task Finish Status
This report provides project managers with additional information about the completion of tasks. It’s always desirable to finish tasks on time or early, but when tasks finish late, it’s often due to growth in their duration. This report includes duration growth in its analysis.
· Finish is Early is the count of tasks with a Finish date earlier than their Baseline Finish date in each period.
· Finish is On Time is the count of tasks with a Finish date on than their Baseline Finish date in each period.
· Late (0 Duration Growth) is the count of tasks that finished later than their baseline but are still the same total duration as their baseline duration. These tasks may have started late due to a late finishing predecessor.
· Late (<=100% Duration Growth) is the count of tasks that finished later than their baseline and their total duration increased. These tasks may be the root cause of late finishes of other tasks.
· Late (>100% Duration Growth) is the count of tasks that finished later than their baseline and their total duration doubled or more. These tasks are likely to be the root cause of late finishes of other tasks and may be putting key program events and deliverables in jeopardy.
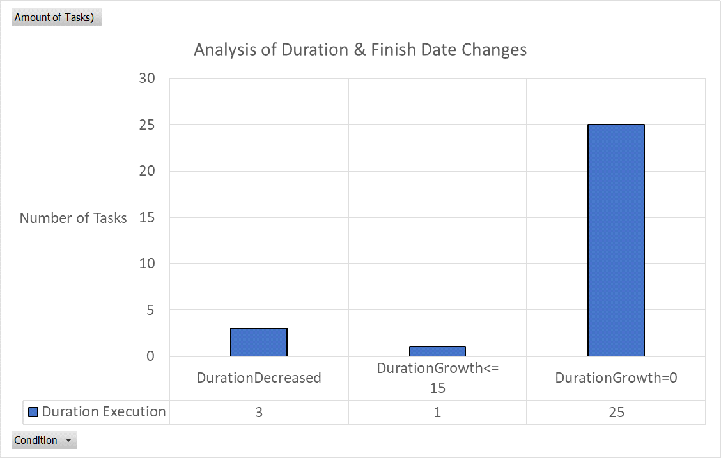
A variation of this report is the Analysis of Duration & Finish Date Changes which measures “Finish Drift”, or the total number of tasks with a delayed or accelerated finish and “Duration Execution” which measures the total number of tasks with duration growth or decreases.